 Radar Introduction
 Weather Radar - A Quick Intro
Have no fear! You don't need to be a meteorologist to enjoy Radar Alive!.
Here we describe the weather radar in what we hope is user friendly (if not meteorologically perfect) terms.
Just Show Me My Weather...
If you just want to see nearby storms, here's how to do it...
- Tap the "center on me" location button:

- Press and hold for a second on the position icon in the center of the screen:

- A menu will pop up for the radar nearest you:
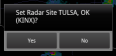
- Tap on "Yes"
The display will then show the radar image from the radar site you selected, which is the closest to your location.
But...
Now, What kind of Image do I want
Radar Alive! remembers the last image ("product") you viewed, and that might not be best.
To see storms in your area, one of the best images is "Composite Reflectivity"
This shows, for each point, how thick the cloud or rain is from near the surface to the top of the atmosphere, although it also may show unwanted ground clutter (see below).
If you want to know what kind of precipitation is happening, use "Hydrometeor Classification .5 162." This will have a different color for different kinds of objects in the air.
Another useful display is "Base Reflectivity Tilt .5"
This shows the amount of cloud or rain near the ground.
How do I Display that Image
Radar Alive! has a wide variety of products it can display.
First, you need to open the product menu
- Tap the radar menu button near the bottom of the screen:

- This will cause a menu to pop up:
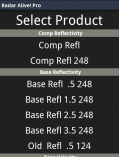
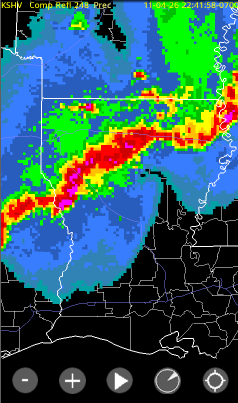
- Choose, for example, "Comp Refl 248" for long range composite reflectivity.
- Radar Alive! will download the data from the internet, and display it. This example shows a line of sever storms across northern Louisiana:.
What Do The Colors Mean?
The colors mean different things depending on which radar "Product" you select:
- For reflectivity, they show how "strong" things are. Technically, it is how much of the radar signal is reflected back, measured in dBZ.
- For velocity, they show how fast the winds are moving relative to the radar beam or, for "storm relative," relative to the storm.
- Other proudcts have other meanings.
Okay, but What does Red Mean? How Can I tell?
There are two ways to find out what each color means.
There is a color "palette" (or color bar) at the bottom of the display. If you touch that bar, it will tell you the meaning of the color where you touch.
To see what all the colors mean, bring up the "Quick Menu" using either a long press on the screen, or from the menu. Select "Color Bar Guide" to see the color descriptions.
What are all these Radar Products?
The Radar scans its surroundings several times every 5 minutes or so. Each scan looks at a different angle above the horizon. Radar Alive! lets you choose the individual scans by how the radar was tilted, and what sort of information it gathered.
The products are divided into categories. Within the category, the product type, tilt angle (if it applies) and range in nautical miles (if relevant) are shown.
The products fall into the following categories:
- Base Reflectivity - This is the amount of energy reflected back to the radar from the beam at all distances as it sweeps around. Base reflectivity is good for looking at storm structure - especially the lowest tilt (.5 degrees), which shows you the reflections closest to the ground. Keep in mind that this is tilted up slightly from horizontal, and also that the earth's curvature adds to the lowest level the beam can see as the distance increases.
- Comp Reflectivity - This is "composite reflectivity." - the total amount of reflectivity at all levels that the radar "looked" at. For each point on the map, the reflectivity is added from all tilt angles that go through that point. This is good for seeing if anything at all is happening, or to get a general idea of the strength and area of a storm.
- Base Velocity - This is why the radar is called a "doppler radar." It uses the doppler effect to measure how fast things are moving towards and away from the radar. Very importantly, it does NOT tell you the wind speed - only how much of the wind is moving towards (green) or away from (red) the site. And, it cannot give any information if there is nothing for the beam to reflect from (such as cloud droplets, hail, etc).
- Storm Rel Velocity - This is the same as Base Velocity, except that it is relative to the storm's motion. If the storm is not moving, this is the same as Base Velocity, but if the storm is moving, this gives the estimated component relative to the motion.
- Misc - This category has various other products:
- Hydrometeor Classification - what is the radar signal reflecting from: rain, snow, hail, etc. This is only at the tilt angle specified. use .5 (half degree tilt) for the lowest above ground.
- Rain - how much rain has fallen in the defined period
- Spectrum Width - this is pretty technical - it is a measurement of how much the velocity varies within a single "point" (voxel) on in the radar scan.
- Echo Tops - how high the cloud tops are. Note that this reading will be wrong near the radar, because it doesn't tilt high enough to see the tops nearby. You can often choose another radar near by to see them in that case.
- VIL - Vertically Integrated Liquidity - tells you how much water is in the storm, from the surface to the top.
What's THIS Nonsense - Radar Artifacts and Oddities
Sometimes the radar shows images that are not correct or just don't make sense. These are called "artifacts" and can be difficult to interpret. They are not usually caused by malfunctions of the radar, but by the environment.
- Ground Clutter - the radar is extremely sensitive. Some of the beam, usually at the lowest tilt angle, will reflect back from nearby objects and even the ground itself. Radar Alive uses a lower threshold than many programs, so this is more likely to be visible, but it also allows "fine lines" (see below) to be seen. Usually ground clutter is relatively smooth just around the radar. At night, sometimes a thermal inversion forms and the radar beam is bent back towards the ground at some distance out. This shows up as a ring of reflectivity a ways out from the radar. If there are mountains, they may cause ground clutter reflections at some distance. Level III data is processed to remove known ground clutter, but this processing only reduces the problem. The Phoenix area radar base velocity often shows vehicles on the 101 freeway near Scottsdale airport.
- Interference - the radar is a radio transmitter and receiver. Some times it will pick up signals from another radar. This appears as a thin wedge shaped echo extending form the radar to the end of its range in the direction of the other radar, with bands in the wedge.
- Wind Farms - wind farms cause a lot of problems for some radar sites (Dodge City, Kansas for example). If they are very close to the radar, they can even cause damage to it. Farther out, the look like storms, and they also have odd velocity signatures. They can also cause other odd images. So far, the NWS has not ben able to develop and deploy software to remove their false echoes. More information (and example images) can be found at http://www.roc.noaa.gov/wsr88d/windfarm/turbinesimpacton.aspx?wid=dev.
- Chaff - combat aircraft discharge "chaff" to block enemy radar signals and cause false returns. Chaff consists of huge numbers of hair thin short strips of tin-coated polymer. Chaff is used during military exercises, and will also show up strongly on weather radar. For example, it is not unusual to see an area of high reflectivity south-west of Phoenix, Arizona, in the Gila Bend gunnery range (and othe rmilitary training ranges in the area). If you see what looks like a cloud or a storm where it shouldn't be, and there's nothing on visible or IR satellite imagery, it may be chaff.
- Range Aliasing/Folding - sometimes the radar sees a strong echo beyond its longest range. This will show up as if it were much closer due to aliasing (too technical to cover here). For example, when the Columbia shuttle burned up on re-entry, its ionization trail was visible on a number of radars (see here for technical article and image). It showed up as a false echo (not in its real location).
- Velocity Aliasing - normally, the radar can only resolve velocities to around 75mph. Higher winds may show up at the wrong speed. NWS processing attempts to remove the aliasing, or suppress aliased signals, so it is rare to see this.
- Fine Lines - fine lines are not artifacts. They are very weak reflections that show up as lines, usually near the radar. Fine lines can show outflow boundaries, dry lines and other items of meteorological interest. Often the reflection is a result of the radar beam reflecting from insects concentrated by the disturbance.
- UFOs - you aren't likely to see any flying objects on weather radar. It scans too slowly with too narrow a beam. So no UFO's!